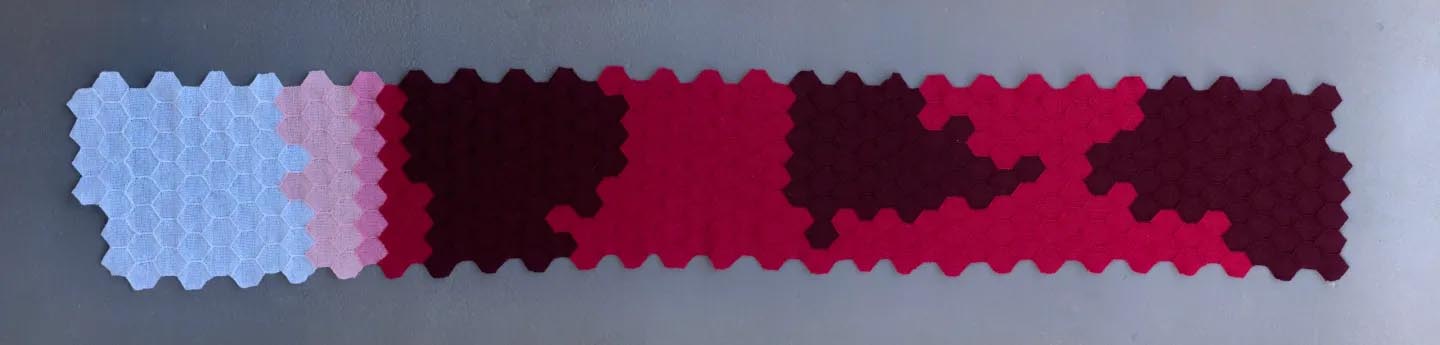
Kristin Briney used a Pin loom to weave hexagons of data for each day of 2020 showing daily COVID fatality data in the United States (Civic Data). This piece uses color as well as chronological data organization.
- white = 0 U.S. COVID deaths
- light pink = 1-9 U.S. COVID deaths
- dark pink = 10-99 U.S. COVID deaths
- red = 100-999 U.S. COVID deaths
- dark red = over 1000 U.S. COVID deaths
There is a detailed write-up of the piece here.