For a final project in Data Visualization with Textiles 2024, Ryan Guan used Class Data, and the properties of quantity, stitch, and color to do an embroidery of five years at Stanford.
My project depicts my past five years at Stanford. Each flower bunch represents one year, and the flowers represent the courses I took that year, categorized by whether they were a requirement or an elective. Spring 2024 is my last quarter at Stanford, so course selection and my academic journey over time have been on my mind.
To find the data, I went through my transcript, categorized the courses I took during each academic year, and counted how many courses fit into each category.
I learned that even when there are seemingly “objective” criteria — such as the binary variable of whether a certain course counts toward a certain degree — the process of labeling data can still be highly subjective.
Some subjectivity comes in the prescribing of labels/categories in the first place. For example, the categorization was essentially arbitrary on my part; I was looking for a way to tell a somewhat coherent story, but I could also have categorized courses by department/school, by my grade in them, by the course number… Also, I only labeled as “requirements” courses that actually counted toward a degree, not including courses that happened to be in the same department.
Even taking the categories as a given, I ran into many edge cases: for example, I included summer courses in the previous academic year instead of counting them separately, and I labeled courses on a case-by-case basis when there was overlap between courses I took for my major and courses that fulfilled other undergraduate requirements.
I also learned more about my academic path objectively, which was one of my goals when reflecting on my coursework. While I’d previously felt regret for not having taken more electives, I realized that I worked toward some of my academic requirements and some electives pretty much every quarter. I also realized that I took fewer than 70 courses here — despite the quarter system, I of course couldn’t take every single class I wanted to.
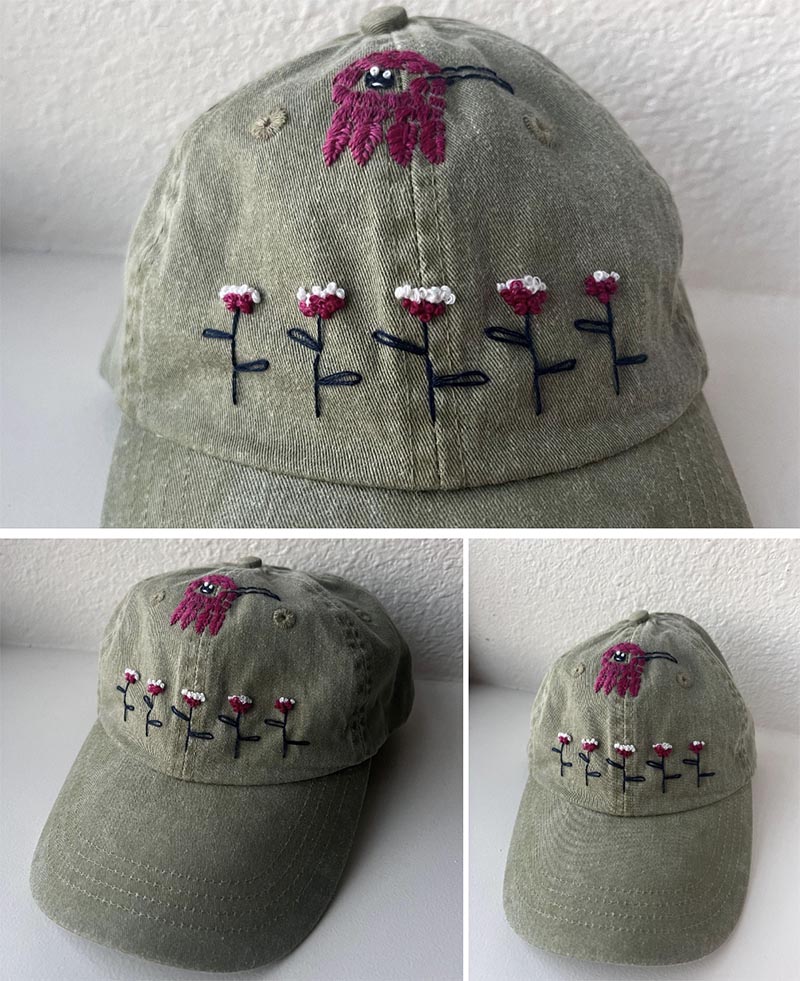
The project is hand embroidery on the front of a baseball cap. Each flower bunch represents an academic year. Time flows left to right, so the leftmost bunch represents the 2019-2020 academic year and the rightmost is the current year (from head-on).
Within each year, each French knot represents one course. I used an embroidery stitch that was not too difficult and that resulted in clear units.
The color of the embroidery floss used for each French knot represents its category.
- White represents courses that counted toward my computer science major or MS.
- Light pink represents courses that counted toward my linguistics minor or toward other undergrad requirements like the language requirement.
- Dark pink represents all other courses, i.e. electives.
- It’s hard to tell the difference between light and dark pink in photos, so the more salient categories are white = technical requirements, pink = everything else.
The flowers were placed arbitrarily in each bunch. The stalks and bird are decorative but the stalks are divided into three in order to represent the three quarters in an ordinary academic year, and the bird is the Anna’s Hummingbird, a year-round resident on Stanford’s campus and one of the first birds I learned to identify here).