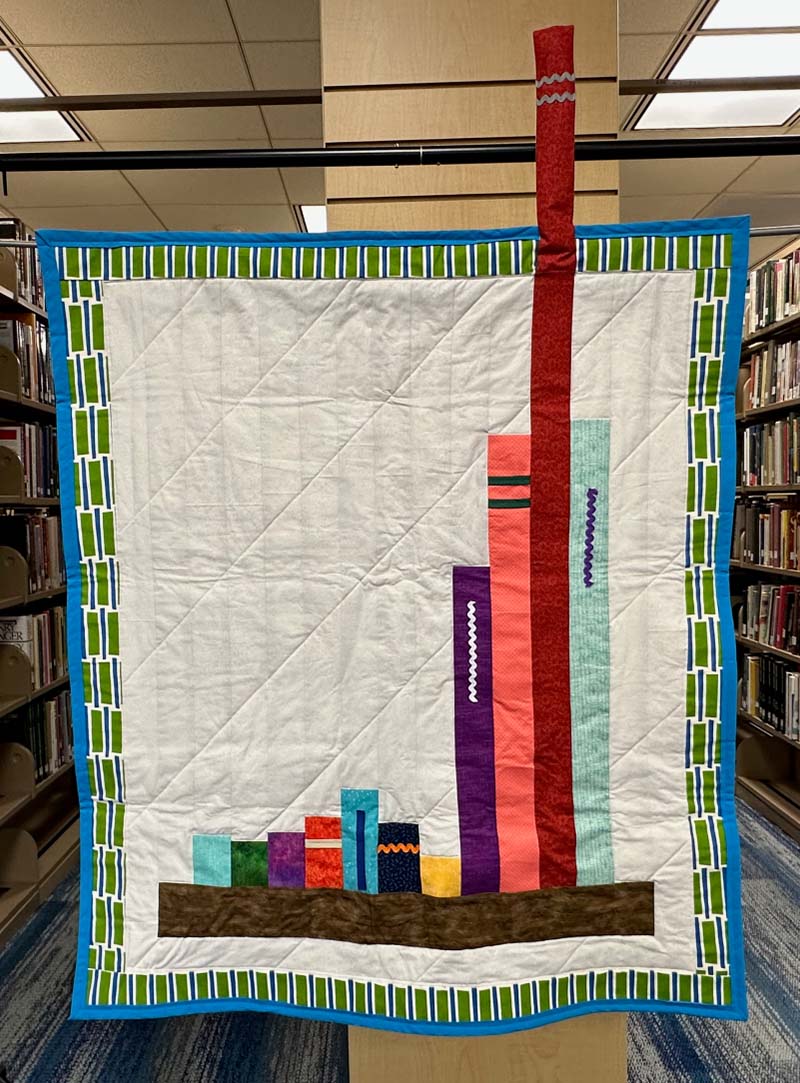
The Challenged Stitches quilt by Dr. Laura Guertin uses Organizational Data from the American Library Association showing the number of books challenged each year for a quilt. The design recreates a standard data visualization bar chart.
The Challenged Stitches quilt by Dr. Laura Guertin uses Organizational Data from the American Library Association showing the number of books challenged each year for a quilt. The design recreates a standard data visualization bar chart.