A knitted piece with complex topology created through different stitches

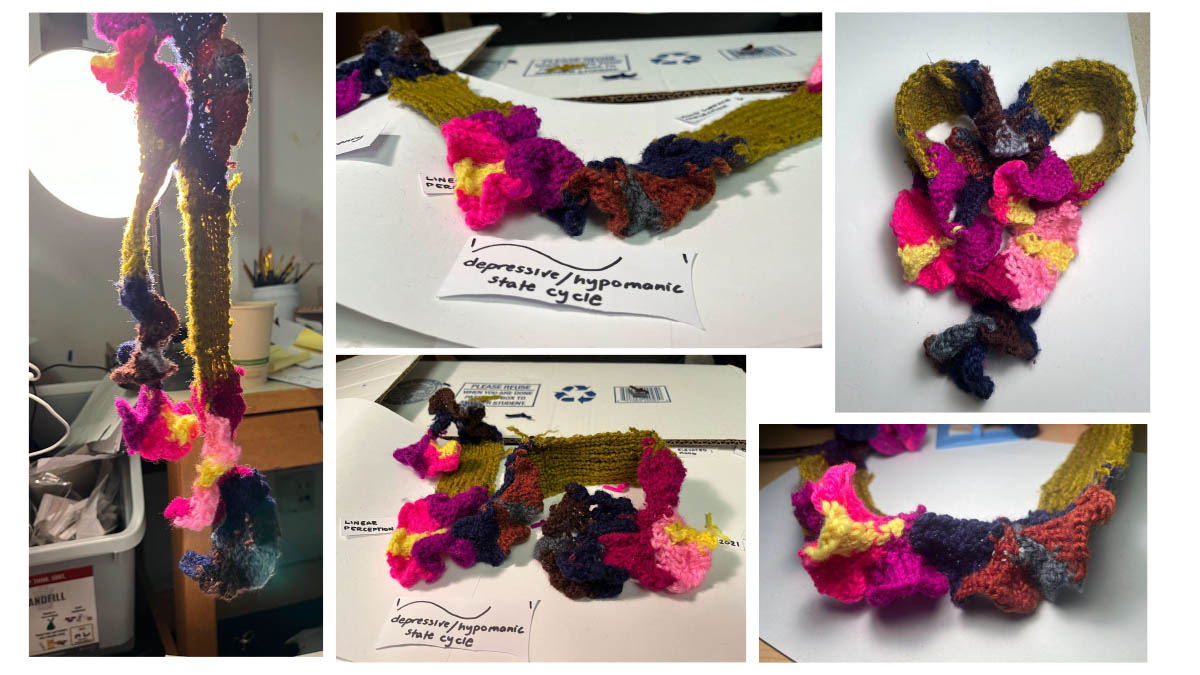
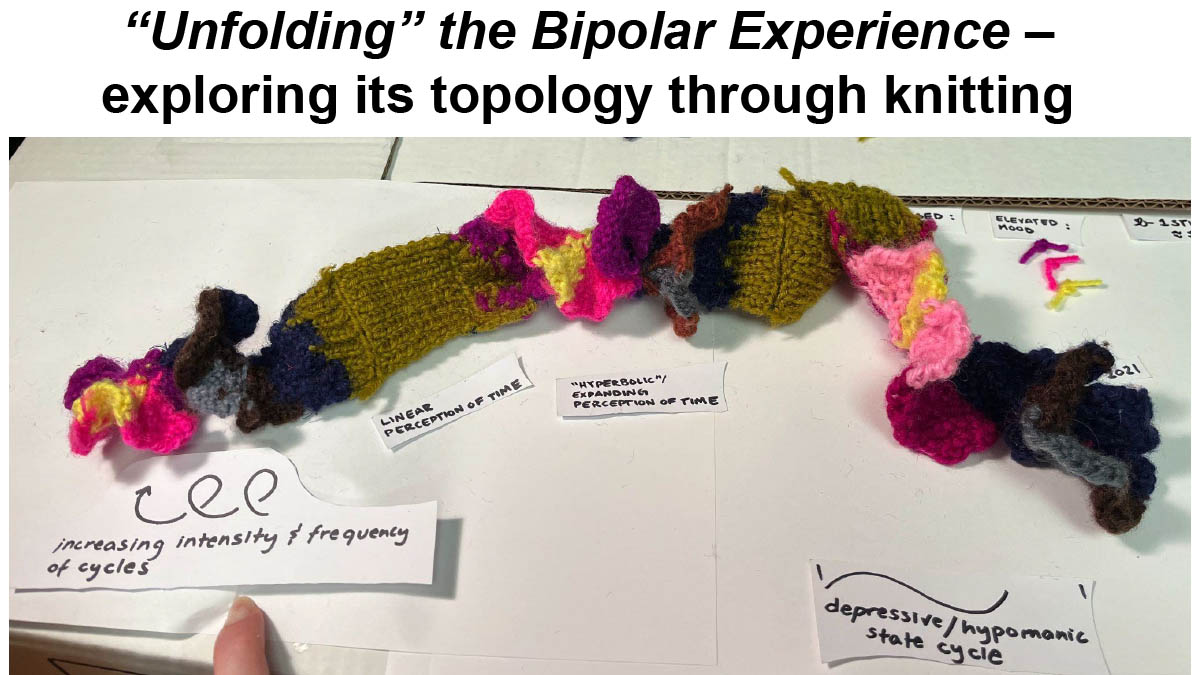
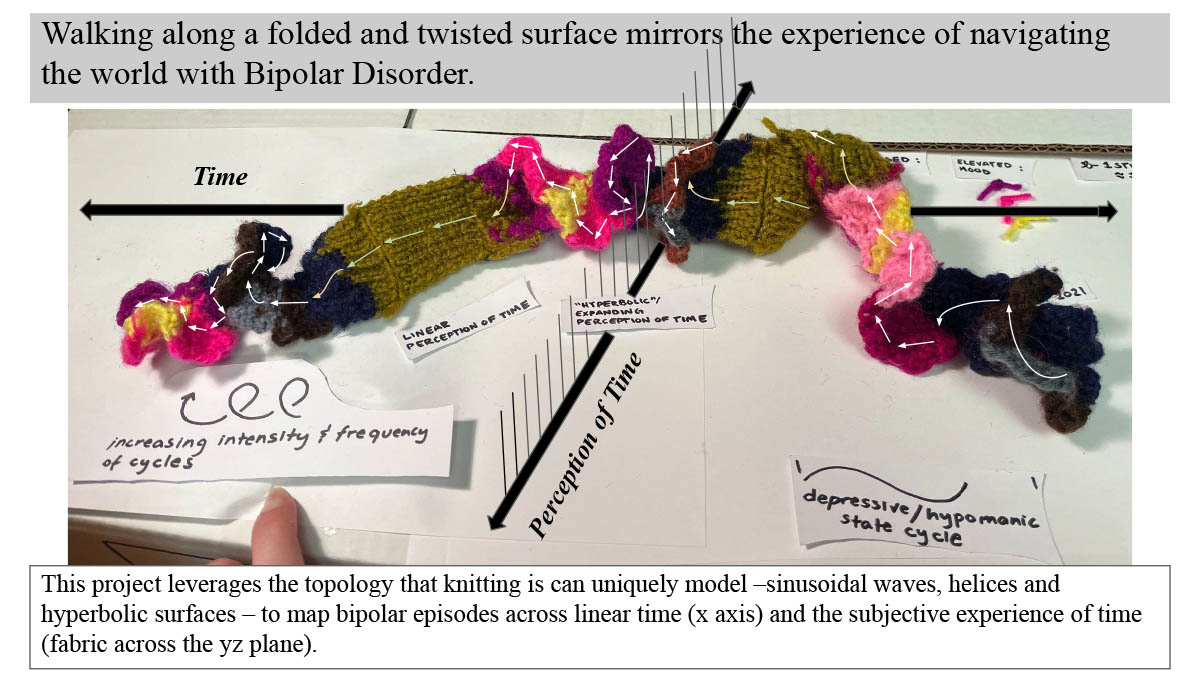
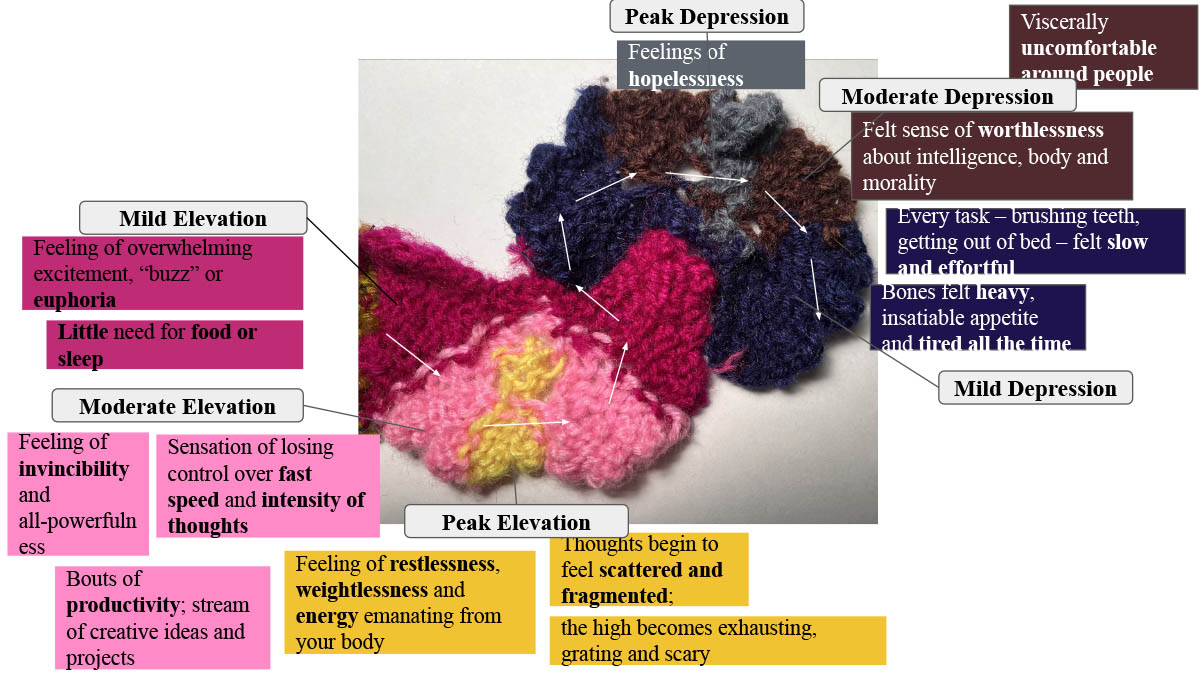
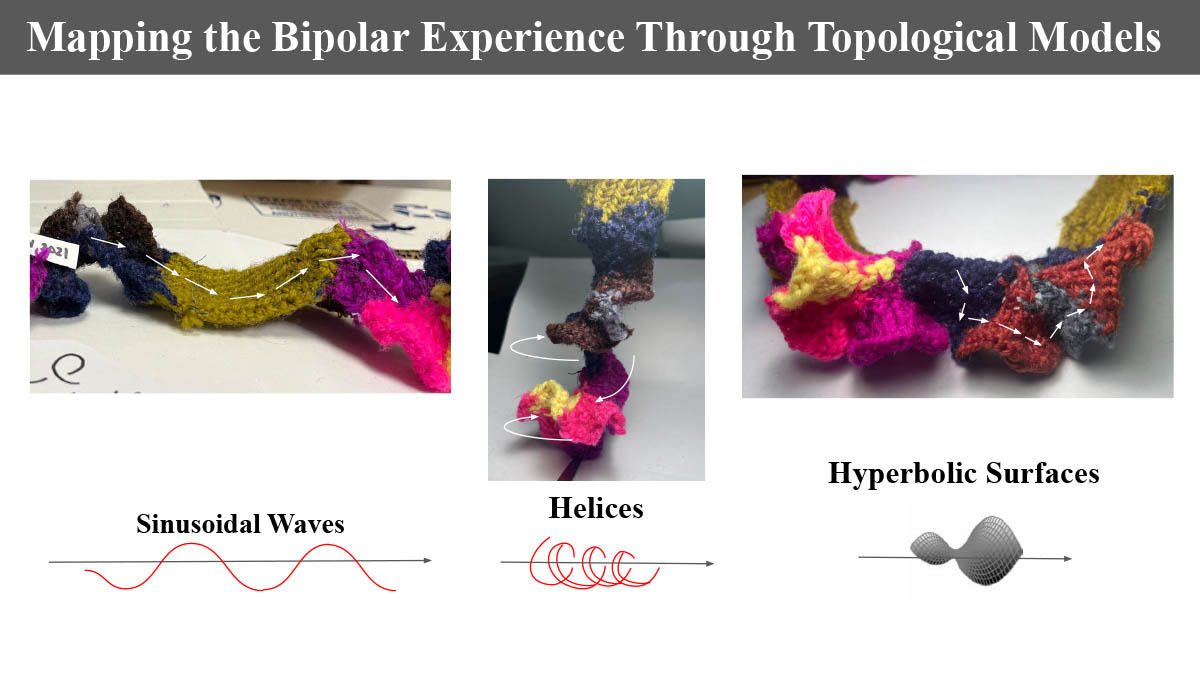
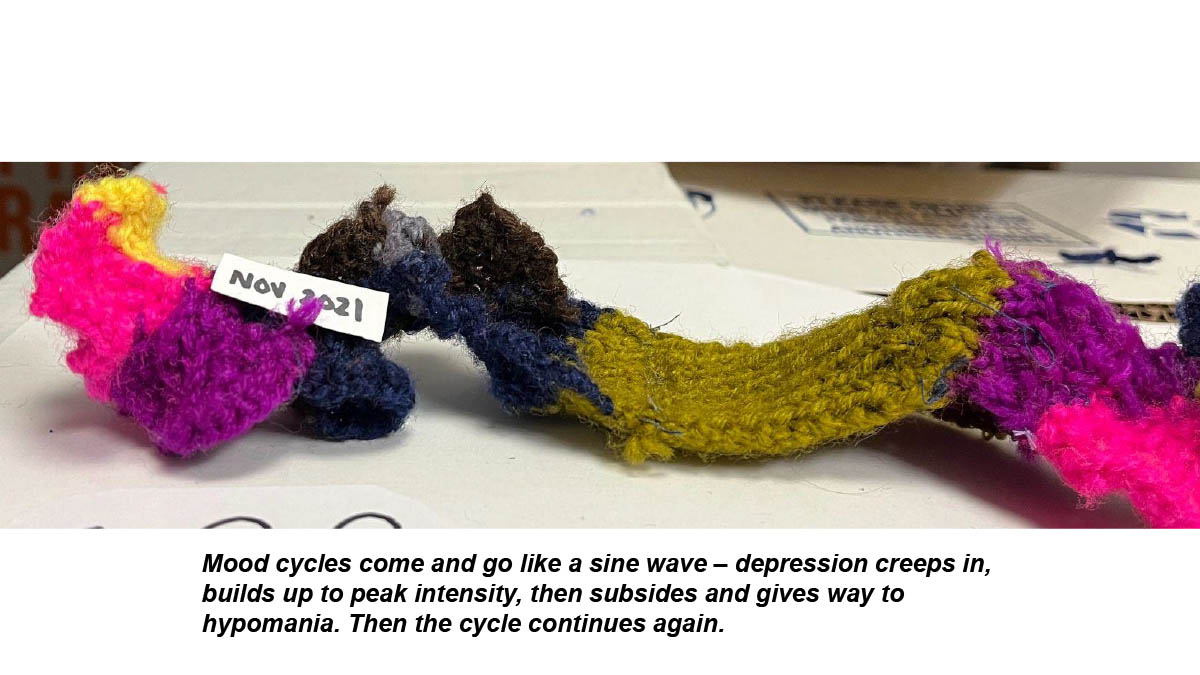
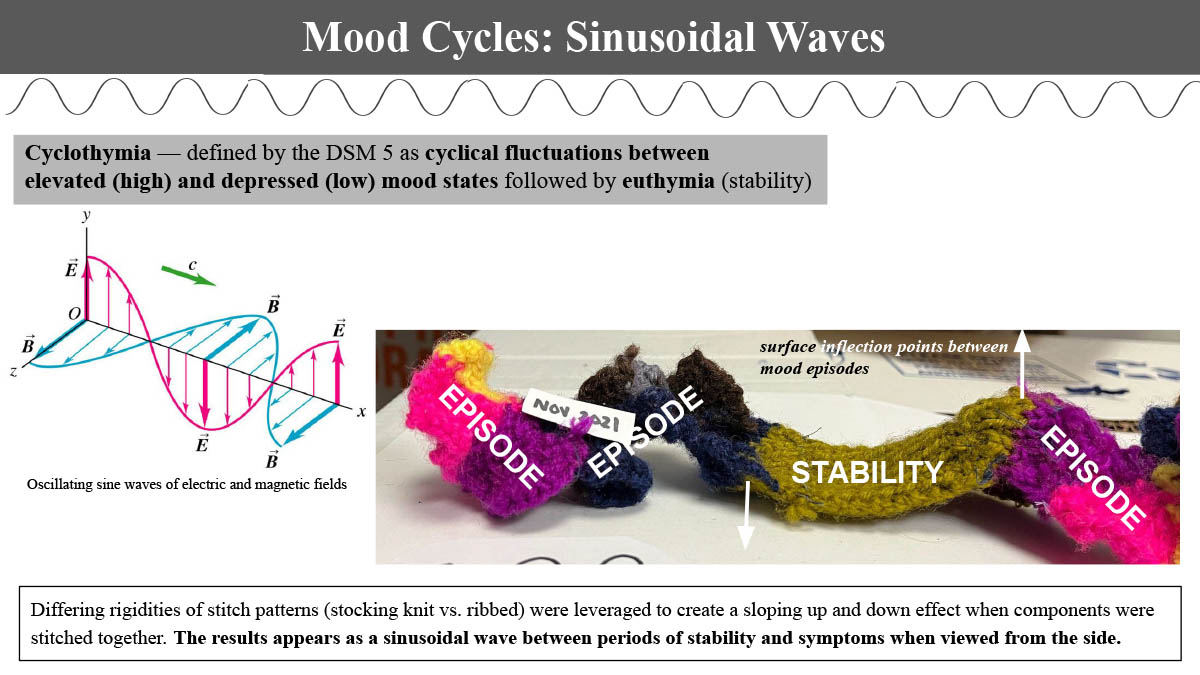
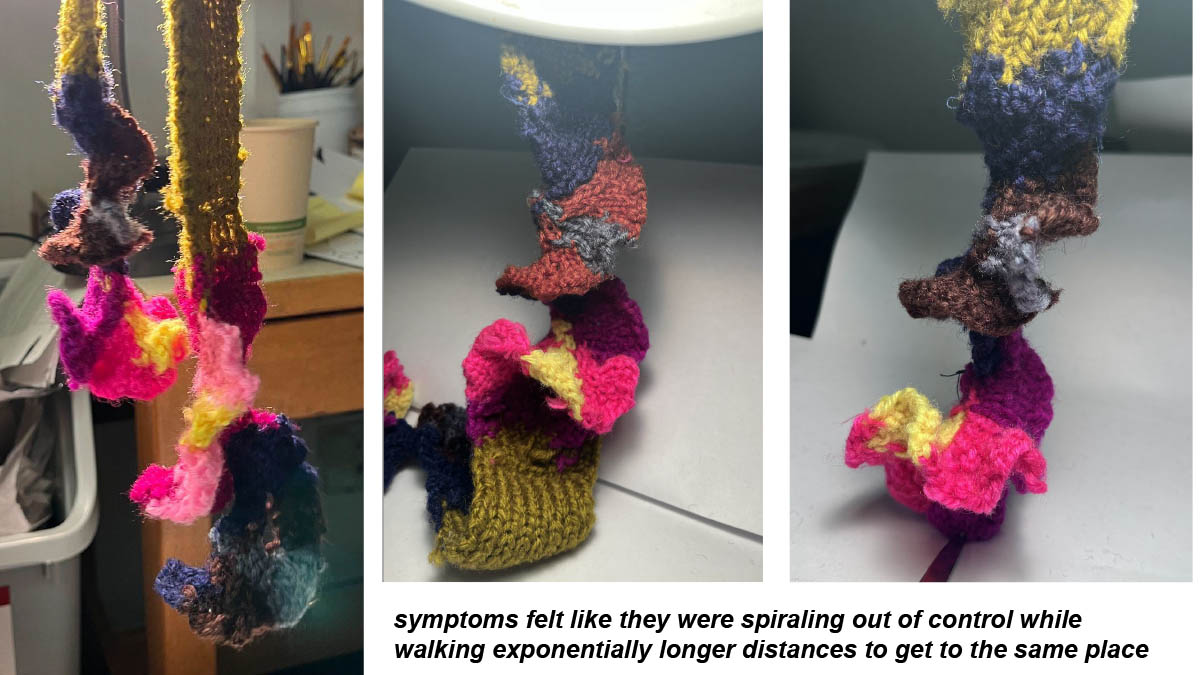
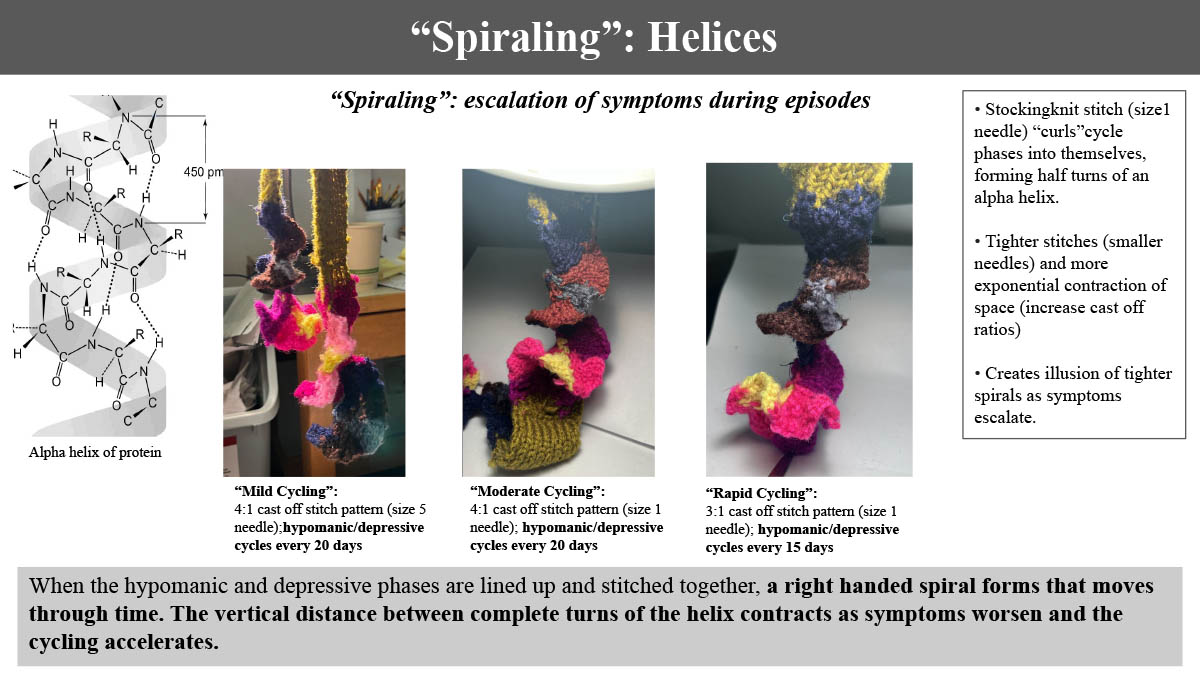
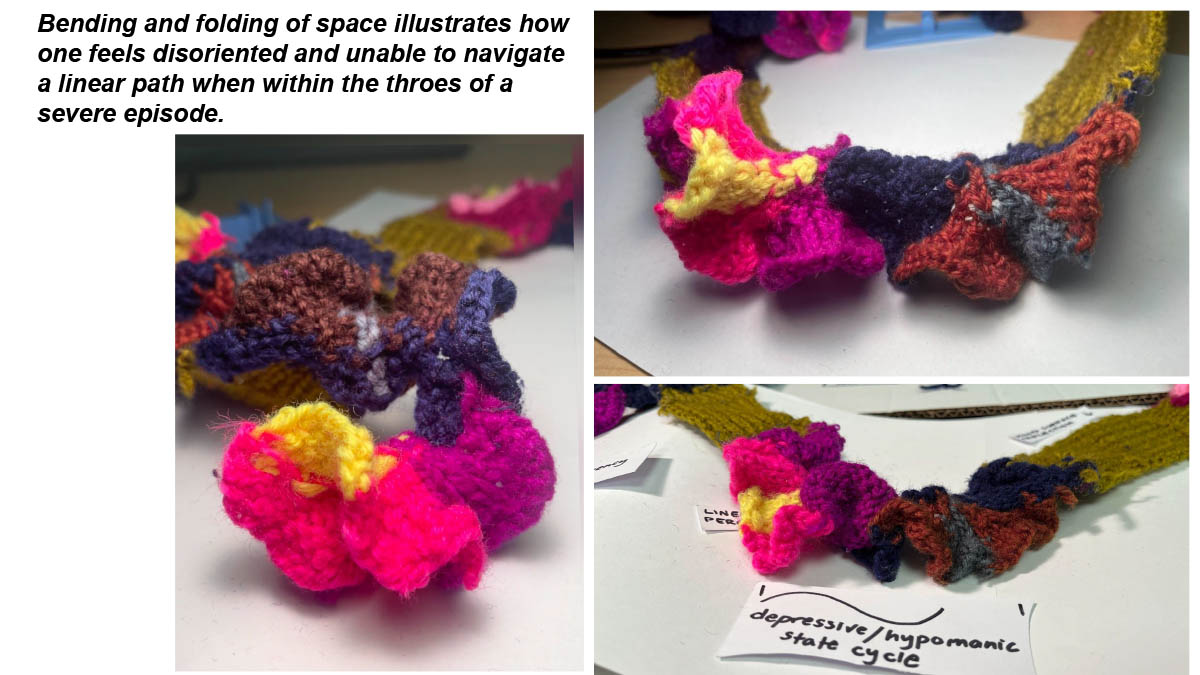
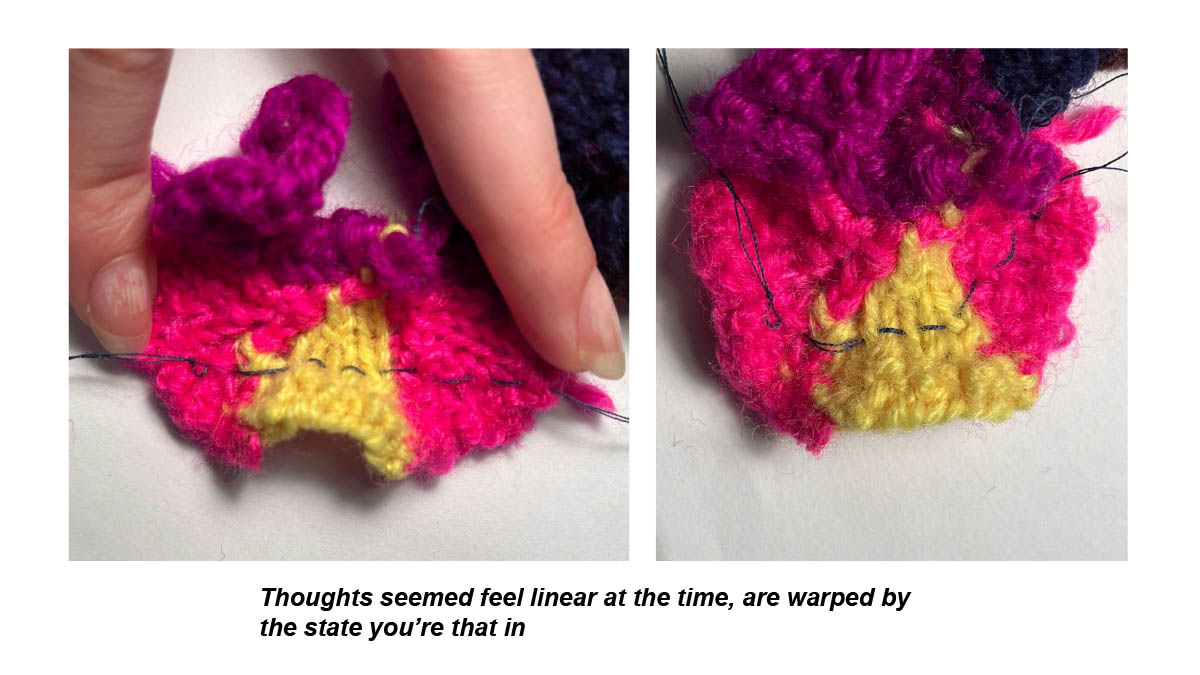
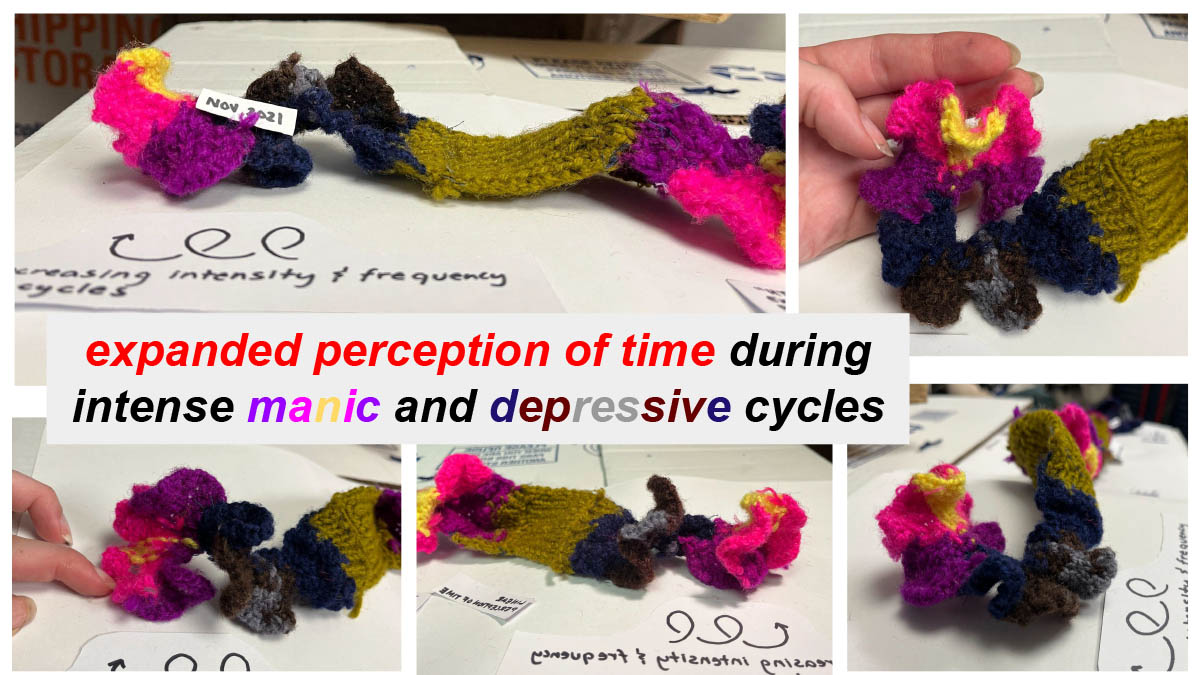
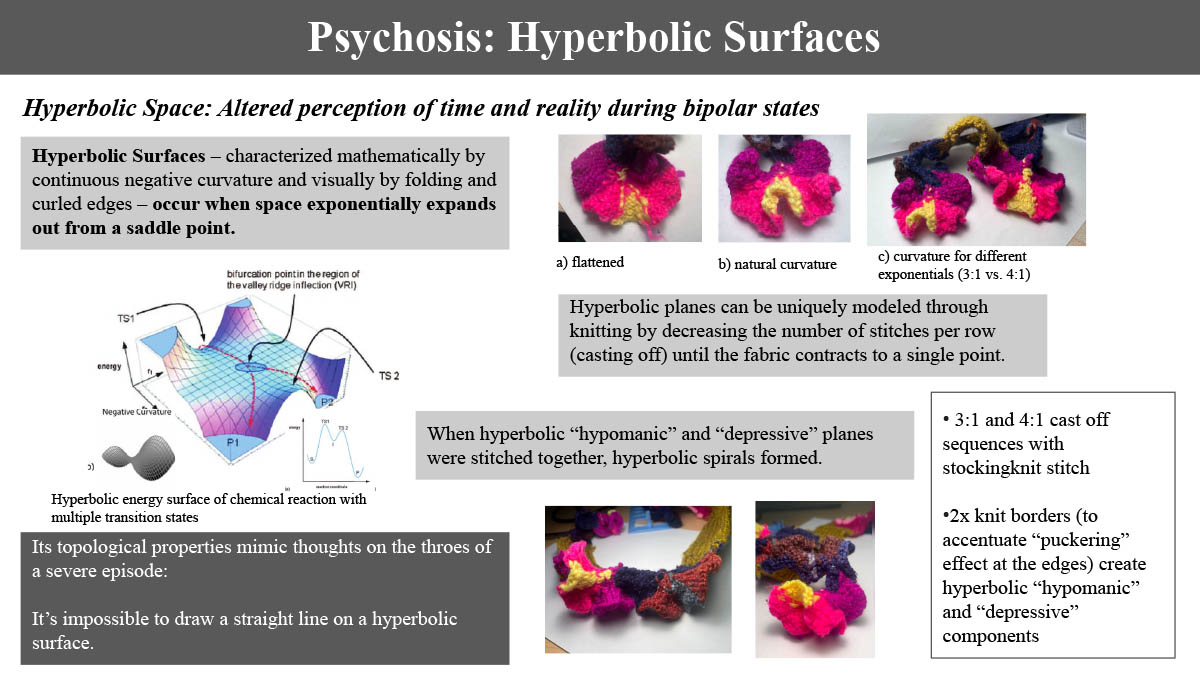
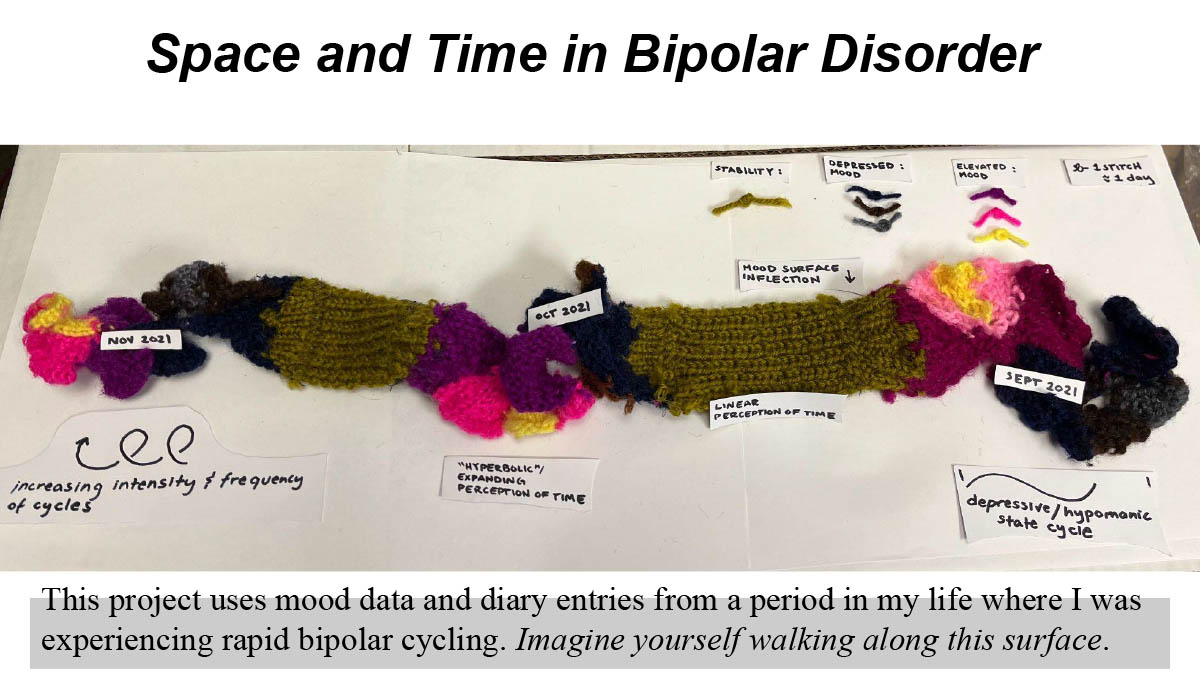
A student in a past Data Visualization with Textiles class asked for their project to be included in the gallery anonymously. They knitted a visualization with a complex topology to visualize their experience with rapid-cycling bipolar disorder.

Various views of the knitting with close-ups of different parts 'Unfolding' the bipolar experience Mapping episodes across linear time and experiential time Close-up of examples of elevation and depression Mapping the bipolar experience through topological models Mood cycles like sine wave Mood cycles as sinusoidal waves Symptoms spiraling out of control Spiraling helices Bending and folding space in a severe episode Seemingly linear thoughts are warped by mental state Expanded perception of time during intense manic and depressive cycles Hyperbolic surfaces representing psychosis