For a final project in Data Visualization with Textiles 2024, Liesl Strand sewed a pair of pants incorporating Scientific Data from a protein interaction experiment.
The dataset I used for this project was generated by myself and another post-doc in my lab, where we broadly study molecular mechanisms of meiosis – the specialized cell division that makes sperm and egg. We do this work in the model organism C. elegans, a microscopic worm that is genetically tractable and optically transparent, which allows us to study a simplified meiotic program that is nevertheless highly similar to human meiosis. One of my projects in the lab is focused on the study of a newly- characterized protein, called DUO-1, which plays an unknown role in meiosis. In order to determine what DUO-1 does during meiosis, we performed an assay called Turbo-ID which allows us to physically tag protein interactors of DUO-1 in live worms during meiosis. We then identify these proteins through a process whose details are not important, but whose output is a list of measurements of how often a particular protein interacts with DUO-1. This dataset of protein interactions is what I used for my project.
The first challenge I encountered during this project was the problem of how to simplify a very large dataset into a visualization that would be aesthetically pleasing, doable for a sewing newbie, and still representative of my data. My original data had three experimental conditions, with three technical replicates apiece, and had identified hundreds of different protein interactors – in short, it was not feasible to represent for this purpose. To simplify the data, I first narrowed my set down to one technical replicate of two conditions: the experimental condition where DUO-1 was present, and a control condition where DUO-1 was not present. This still left the problem of hundreds of proteins, so I then narrowed that list down to a subset of 27 proteins. These proteins were cherry-picked to include a range of different kinds of proteins that often show up these experiments, as well as a few proteins known to be involved in meiosis, some of which were exciting finds that I am following up with in my current research. In the end I had three different types of proteins that were allotted three different colors: cytoskeletal (brown, mountainous fabric), meiotic, but not anything worth following up on (blue fabric), and nuclear-localized (yellow/gold fabric). I then had 7 more individual proteins represented by other fabrics, notably among those is DUO-1 itself, represented in red snakeskin fabric, and only present in the experimental condition.
I decided that the representation would be down the side of the pants in bars of differently-sized fabric block ladders. I rounded protein reads to the nearest 10 and then converted that to inches so that a measurement of 10 was equal to 0.1 inches. I wanted to be able to compare proteins directly so that the protein 1 (experimental condition) would be even with protein 1 (control condition), protein 12 (experimental condition) with protein 12 (control condition), etc. To do this, I filled in unequal data with black fabric, here are a couple of illustrative examples:
- If cytoskeletal protein A is 120 in the experimental condition, and 0 in control, both bands are 1.2 inches thick, brown in experimental, and black in control.
- If nuclear protein B is 30 in experimental, and 50 in control; both bands are 0.5 inches thick with control being all gold, and experimental having 0.3 inches gold, and 0.2 inches in black.
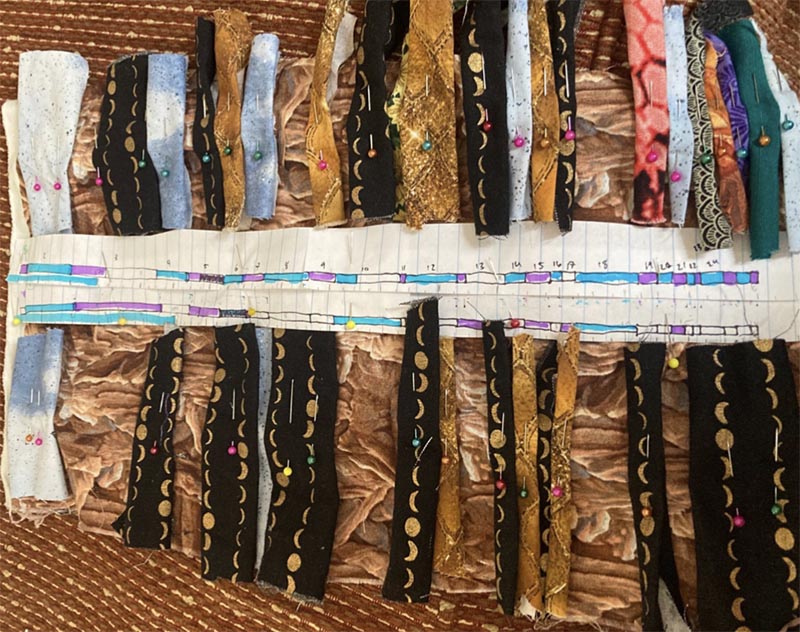
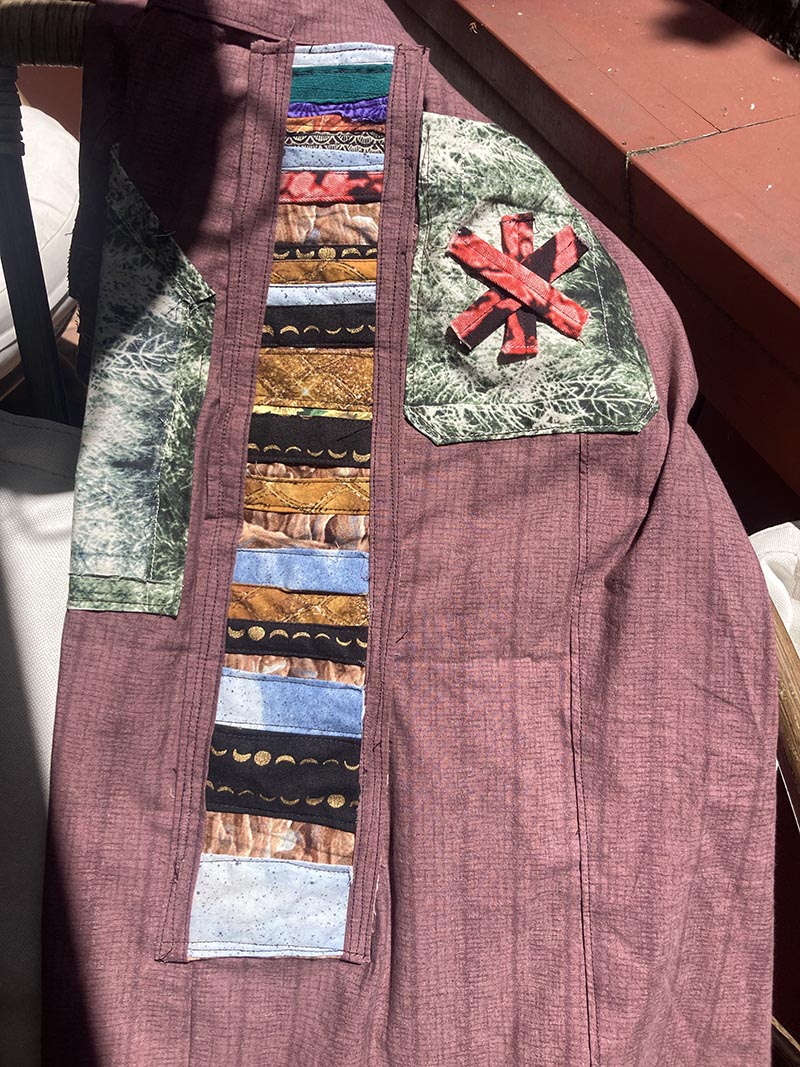
I then used the cytoskeletal brown fabric as a backdrop and sewed strips of each color on top of it (see above image). This proved finicky with smaller values, but overall I think it came out pretty well. Finally, I trimmed the edges, separated the two conditions, and added more trim around the edges to make it all look cleaner. Now I had the data, all that was left to do was make the pants! After adding the pockets, I added an asterisk (*) to one pocket, which is often used to denote an experimental condition in biology. I then added on my side- striped data to the appropriate sides of the pant legs.
The hardest bit turned out to be figuring out how to represent the data, which makes sense. While I like the look of it in the end, I do think that because of how I limited the data, it’s no longer very representative of what the whole dataset looked like. It does still get across the idea that some proteins are broadly the same in the two experimental conditions, but that we get a bunch of other interesting proteins in the experimental DUO-1 condition that we don’t see in the control. So, not completely unrepresentative, but I would have liked to figure out a better way to represent more of the data so that a fuller picture would be presented – maybe something like weaving would have been better for that. I also think I should have used the black ‘no-signal’ data as the background (rather than the mountainous brown of the cytoskeletal class proteins) just to make things a little easier on me.