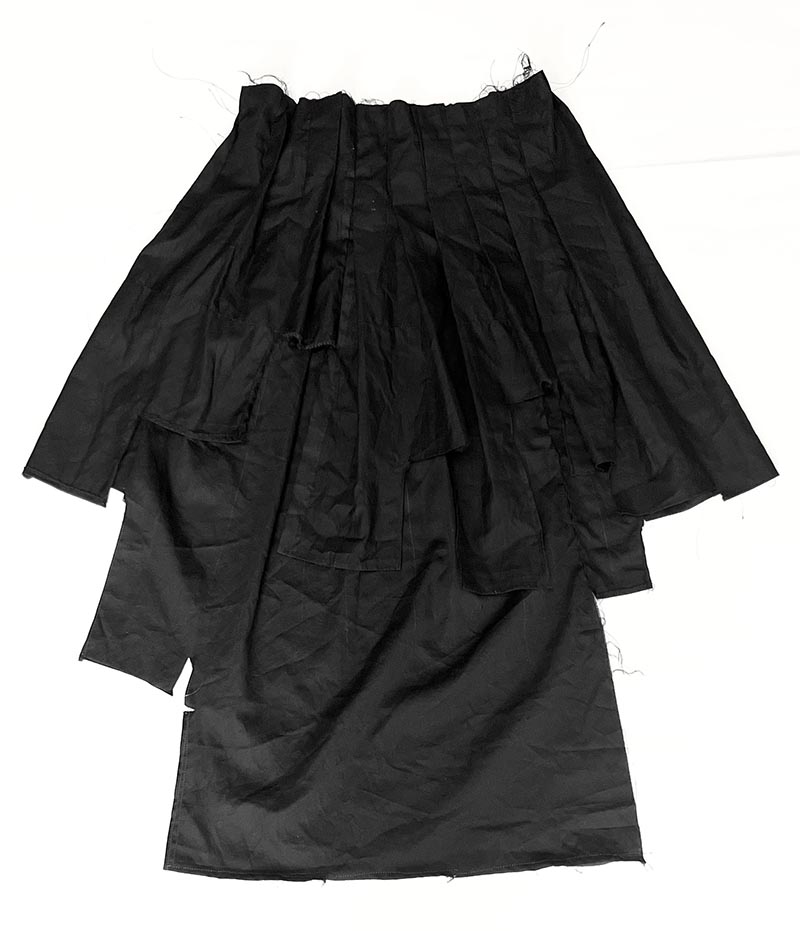
For a final project in Data Visualization with Textiles 2024, Adaeze Chukwuka sewed a skirt using Temperature Data from 1951-1980 and the property of size:
For my project, I knew that I wanted to do something environmental, so I looked for relatively simple climate-related data. I stumbled across an interactive radial data visualization from 2021 on climate change that used distance from the baseline of 1951-1980 temperature mean to determine how “off” the temperature was. I found it through a twitter Tableau community that I am a part of. For simplicity’s sake, I pared down the data and only used data points from every 10 years. I thought that if I included too many data points, besides being a lot more work for me, the jumps would make the skirt look too disheveled. In Google Sheets, I first ran through every step of the visualization to record the year and the corresponding temperature difference. (Looking back, I probably could’ve just made a copy of the visualization and downloaded the data.) Then, I ran a filter through the data to scale it to centimeters for my skirt (by multiplying the absolute value of the temperature difference by 54.9019608). I learned some basic Google sheets through this process, but I do think most of it was in my wheelhouse.
To get the 54.9019608 filter value for the skirt, I first measured how long I wanted the longest pleat to be (which was about 81 cm, or to my ankles), and then subtracted the lengths of one of my miniskirts because some of the data points were at or near 0. I made sure to stitch a line at the length of the miniskirt (where the data actually starts) for clarity. I used a bar graph in my Google sheet to get a rough preview of how the pleats would look. Then, after measuring out the pleats every 4 cm through the width of the skirt fabric, I measured the scaled value from the miniskirt line toward the bottom of the skirt and cut off the excess. This was what created the “bars”.
If I could do this project differently, I would choose a stiffer fabric, use data points taken every 5 years instead of every 10, and scale the data so that the difference in pleat length is not as drastic. While I like the cotton fabric, I think having such long pleats would hold longer with a stiffer fabric. I also think the fact that I have few data points actually makes the jumps in length between pleats stand out more, which is the opposite of what I’d predicted. I’d like to try this again with more data points in the future.
Another way that I’d like to try this project is to make a circle skirt and then place ruffles at the different heights. This would probably be a gentler, more wearable representation of the data.